You are on the Investment solutions website for advisors & wealth management firms.
Browse more Fidelity websites here.
U.S. equities have reached new highs this summer, with the S&P 500 closing at a record 7,798.99 on August 13 before finishing August 14 near that level at 7,785.76.1 To many investors, such highs feel like warning signs—a signal that gains are spent and a correction is due. We would fade those concerns. Record highs alone are not a reason to step aside, particularly when the economy and earnings backdrop remain constructive. The fundamentals remain solid—although volatility could come from Federal Reserve policy decisions, valuation pressure, or a loss of momentum in the artificial intelligence (AI) narrative—which is not our base case.
The discomfort of investing in a record high is one of the most reliable, and most expensive, instincts in markets. It rests on the intuition that a high must be followed by a fall. The historical record says otherwise—and not by a trivial margin. Since 1920, investing in a day the S&P 500 closed at an all-time high produced average forward returns of roughly 9.9% over the following year, 36% over three years, and 63% over five years (Exhibit 1). Those results were not merely comparable to the returns earned investing on all other days—they were modestly better: about 10 basis points higher over one year, and roughly 420 basis points higher over both the three- and five-year horizons.2
A gap of that size compounding over multiyear periods is meaningful, not noise. The explanation is structural rather than lucky. In a market that rises over time, new highs are not an anomaly to be feared but a feature of the trend, and an index that compounds spends much of its life at or near a record. An investor waiting for the "all clear" that a new high seems to withhold is, often, waiting to be left behind.
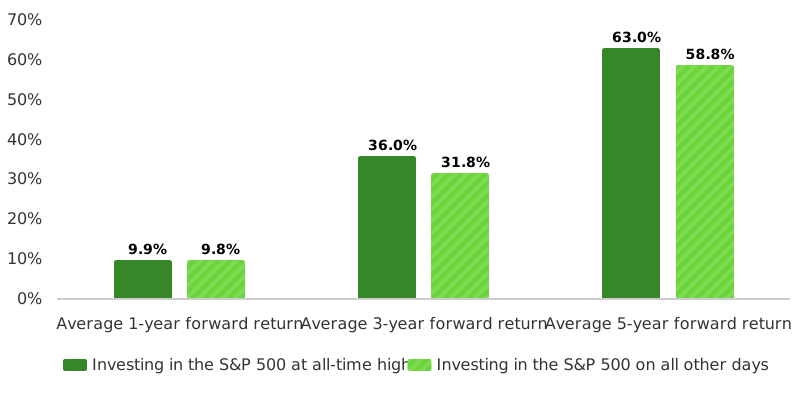
Past performance is no guaranteed of future results. Forward returns calculated using daily data. It is not possible to invest directly in an index. All market indices are unmanaged. Index performance is not meant to represent that of any Fidelity fund. Source: FactSet, as of 6/30/26.
The premise is worth pushing back on: The market is not defying gravity so much as reflecting the strength beneath it. The highs rest on fundamentals, not on momentum alone.
Taken together—resilient earnings, expanding output, activity surveys at multiyear highs, and a labor market that is cooling without cracking—this is the profile of an economy still in the mid-phase of its cycle, not one on the verge of recession.
The main risks are monetary policy, valuation sensitivity, and the possibility—not our base case—that AI enthusiasm fades:
The point is to define the risk precisely. A hawkish Fed or AI air pocket could create volatility, but neither would automatically undermine the broader fundamentals case. Investors should be prepared for periods of market turbulence without interpreting short-term volatility as a shift in the underlying trend.
For clients holding cash, history argues against waiting for records to “clear”; averaging in can reduce the emotional hurdle without abandoning a rising market. For clients already invested, the focus should be on managing volatility through diversification and ballast, not avoiding equities because prices are high. The fundamentals behind these highs are real, and so are the risks—but record highs, by themselves, have rarely been a good reason to sell.


FOOTNOTES
1 FactSet. S&P 500 data, Aug. 14, 2026.The information contained herein is general in nature and should not be construed as legal or tax advice. This material is not intended to provide, and should not be relied on for, tax, legal, investment, or accounting advice. Tax laws and regulations are complex and subject to change. You should consult your own tax, legal, investment, and accounting advisors before engaging in any transaction.
Some of this information is forward-looking and is subject to change.
Views expressed are as of the date indicated, based on the information available at that time, and may change based on market and other conditions. Unless otherwise noted, the opinions provided are those of the authors and not necessarily those of Fidelity Investments or its affiliates. Fidelity does not assume any duty to update any of the information.
Investment decisions should be based on an individual’s own goals, time horizon, and tolerance for risk.Stock markets, especially foreign markets, are volatile and can decline significantly in response to adverse issuer, political, regulatory, market, or economic developments.
The S&P 500 index is a market capitalization-weighted index of 500 common stocks chosen for market size, liquidity, and industry group representation to represent U.S. equity performance.
Sectors and industries are defined by Global Industry Classification Standards (GICS®), except where noted otherwise.