You are on the Investment solutions website for advisors & wealth management firms.
Browse more Fidelity websites here.
Is the current yield curve flashing a warning for stocks? A recent flattening in the Treasury curve has revived concerns that the bond market is sending a warning for stocks. We think that interpretation is premature. A bear flattener can occur for constructive reasons, including strong economic growth, contained long-term inflation expectations, confidence that Fed policy will work, and healthy earnings growth. We believe all four conditions are present today.
If the flattening yield curve isn’t a cause for alarm, is the current scenario still positive for equities? A more cautionary signal than the flattening curve would be a sustained move back toward inversion—but we’re not seeing this right now. Key recession indicators remain positively sloped. A flattening curve is something to monitor as the cycle matures, but current conditions remain supportive of equities.
Last month, we argued that the rise toward a 5% 10-year reflected growth rather than fear.
This week, we turn from the level of yields to their shape, addressing the most recent round of questions from clients.
At the broad level, the curve has done what a healthy curve should. The two-year/10-year spread was negative from July 2022 until late summer 2024, the longest inversion in the modern record, and it is now solidly positive. It got there mainly because long-term yields rose and the term premium rebuilt, not because the Fed cut aggressively.
Over the past year, the Treasury curve has generally steepened as long-term yields rose faster than short-term ones.
More recently, however, the curve briefly flattened after the Fed's September rate hike, as markets priced in additional tightening. That move has revived concerns about what a flatter curve may be signaling for stocks.
A bear flattener typically occurs when the Fed is tightening and short-term yields rise faster than long-term ones. Because the front end of the curve is heavily influenced by monetary policy, it often moves first when investors expect additional rate hikes.
The long end reflects longer-term expectations for growth and inflation and may move less if investors believe the Fed will get inflation under control.
That's why a flattening curve, by itself, is an incomplete signal.
Constructive flattening:
Cautionary flattening:
Where are we now?
Today’s environment aligns with all four parts of the constructive case.
On the cautionary conditions, the picture is mixed but not threatening.
The curve earns its place as a signal because recessions, not rates, have been the recurring threat to equities.
A common argument is that stocks have historically struggled when the 10-year Treasury has yielded 5%–6.5%. Since 1953, the S&P 500 has returned about 4% over the following 12 months and advanced only 62% of the time when Treasuries were in this range (Exhibit 1).
These numbers hold up, but they leave out the most important variable. Remove recession periods and returns in the same range rise to about 9% with an advance rate of 78%—broadly in line with other regimes.
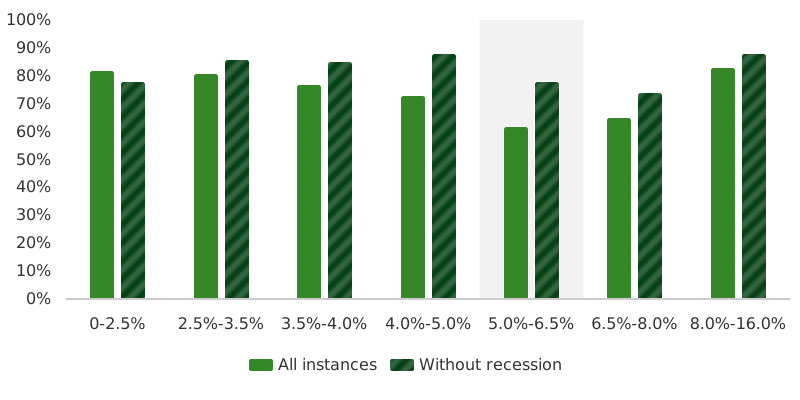
Shaded area indicates the current yield range for the 10-Year U.S. Treasury, as of 10/16/26. The National Bureau of Economic Research defines a recession as a significant decline in economic activity that is spread across the economy and that lasts more than a few months. While each of the three criteria—depth, diffusion, and duration—needs to be met individually to some degree, extreme conditions revealed by one criterion may partially offset weaker indications from another. Source: Haver Analytics and Fidelity Investments, as of 10/16/26.
For equities, Fed-driven flattening has historically changed the character of returns more than their direction. Return dispersion tends to rise, and quality and earnings growth tend to be rewarded. We saw that through the third quarter: The S&P 500 sits near its high while the average stock has lagged since mid-August. That extends the case for selectivity we have made in past pieces.
If the risk arrives, we believe it arrives later. If flattening eventually leads to inversion, that would be a problem: The bond market would be signaling that policy has become restrictive enough to threaten growth. We’d watch three signals for that turn: the three-month/10-year spread resuming a sustained move toward zero, high-yield spreads widening persistently rather than drifting, and the labor market shifting from slow hiring to rising layoffs. Each would raise the probability of the one outcome that has historically mattered for equities. None of these signals are flashing today.
Many clients hear “flattening curve” and think “recession.” The mechanics behind curve flattening are more nuanced than that. Today's curve remains positively sloped, and the measures most closely associated with recession risk are moving away from inversion, not toward it.
The more useful question is not whether the curve is flattening, but why. The answer appears to be stronger growth, resilient earnings, and expectations for higher-for-longer policy rates rather than growing recession risk.


The S&P 500 index is a market capitalization-weighted index of 500 common stocks chosen for market size, liquidity, and industry group representation to represent U.S. equity performance.
The S&P Global Composite PMI is a survey-based indicator of private-sector business activity that combines manufacturing and services data to provide a timely measure of overall economic conditions. Readings above 50 indicate an increase in activity from the previous month, while readings below 50 indicate a decrease.
The information contained herein is general in nature and should not be construed as legal or tax advice. This material is not intended to provide, and should not be relied on for, tax, legal, investment, or accounting advice. Tax laws and regulations are complex and subject to change. You should consult your own tax, legal, investment, and accounting advisors before engaging in any transaction.
Some of this information is forward-looking and is subject to change.
Views expressed are as of the date indicated, based on the information available at that time, and may change based on market and other conditions. Unless otherwise noted, the opinions provided are those of the authors and not necessarily those of Fidelity Investments or its affiliates. Fidelity does not assume any duty to update any of the information.
Diversification does not ensure a profit or guarantee against a loss.
Investment decisions should be based on an individual’s own goals, time horizon, and tolerance for risk.
These materials are provided for informational purposes only and should not be used or construed as a recommendation of any security, sector, or investment strategy.
Stock markets, especially foreign markets, are volatile and can decline significantly in response to adverse issuer, political, regulatory, market, or economic developments.