You are on the Investment solutions website for advisors & wealth management firms.
Browse more Fidelity websites here.
Kevin Warsh was confirmed as the 17th Federal Reserve Chair on May 13 in a largely partisan vote. He takes office having called for "regime change" at the Fed—less forward guidance, fewer press conferences, and a new inflation framework. He also inherits CPI at 3.8%, PPI running at its hottest pace since December 2022, and a committee whose composition he does not fully control. The environment is complex, and the range of plausible policy outcomes is wider than markets currently reflect.
Three constraints shaping the June meeting:
The more important question: Why are rates where they are?
The conversation around interest rates tends to focus on direction and level. Historically, however, outcomes have been driven less by how rates go, and more by why they are rising.
Rates driven by strong GDP growth, capital investment, and earnings reflect demand for capital. By contrast, rates rising due to supply shocks or entrenched inflation signal tighter financial conditions.
The two environments have produced very different outcomes for risk assets.
What history says about high real rates
Across nearly nine decades, both equities and bonds have delivered their strongest risk-adjusted returns when real rates were in their highest historical quartile.
Past performance is no guarantee of future results. All indexes are unmanaged. You cannot invest directly in an index. Risk-adjusted returns are shown as Sharpe ratios, defined as excess return per unit of volatility, using real (inflation-adjusted) returns and a real risk-free rate. The risk-free rate is proxied by real long-term U.S. Treasury yields, calculated as the U.S. Long-Term Treasury Composite Yield (U.S. Federal Reserve) minus year-over-year Consumer Price Index (CPI-U, all items) inflation (Bureau of Labor Statistics). Risk-adjusted bond returns are based on the Bloomberg U.S. Long Treasury Index, and risk-adjusted stock returns are based on the S&P 500 index. Sharpe ratios are calculated using quarterly data and grouped into quartiles based on prevailing real rate environments. Time period: 12/31/1935–3/31/2026. Source: Bureau of Labor Statistics, U.S. Federal Reserve, Haver Analytics, Denise Chisholm, and Fidelity Investments, as of 3/31/2026.
Why? High real rates have historically coincided with strong nominal growth environments, where corporate earnings power and pricing offsetting the impact of higher discount rates.
What’s happening in the current economic environment? It reflects both dynamics. The geopolitical energy shock is indeed a supply-side pressure. But underlying economic drivers—capital spending, corporate earnings, employment and credit—underpin an expansion that’s still in progress.
Where we are in the business cycle
Beyond the rates debate, the business cycle remains the most important driver of intermediate-term portfolio outcomes—and the current positioning looks constructive.
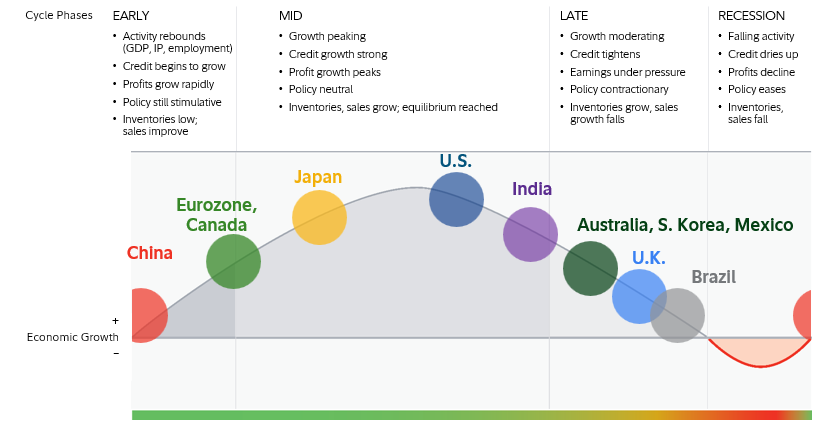
A growth recession is a significant decline in activity relative to a country’s long-term economic potential. Note: The diagram above is a hypothetical illustration of the business cycle, the pattern of cyclical fluctuations in an economy over a few years that can influence asset returns over an intermediate-term horizon. There is not always a chronological, linear progression among the phases of the business cycle, and there have been cycles when the economy has skipped a phase or retraced an earlier one. Source: Fidelity Investments (AART), as of 3/31/26.
The U.S. is firmly mid-cycle: credit growth looks solid, profit growth is near its peak, policy is close to neutral, and inventories and sales are in equilibrium. Mid-cycle expansions have historically been the most durable phase for risk assets, characterized by broadening earnings growth rather than the credit tightening and margin pressure that define late-cycle deterioration.
The global picture adds context. China is early-cycle, with momentum still building. Japan, the Eurozone, and Canada are transitioning from early- to mid-cycle. The demand impulse from non-U.S. economies is still developing—a modest but meaningful positive for globally diversified portfolios and U.S. companies with international exposure.
KEY TAKEAWAYS


Index definitions:
U.S. Long-Term Treasury Composite Yield measures the average yield on long-term U.S. Treasury securities, typically those with maturities greater than 10 years, as compiled by the U.S. Federal Reserve. It is often used as a proxy for long-term government borrowing costs and as an approximation of the long-term risk-free rate when adjusted for inflation.
Consumer Price Index for All Urban Consumers: All Items (or CPI-U, all items) is a widely recognized measure of inflation published by the U.S. Bureau of Labor Statistics. It tracks changes in the prices paid by urban consumers for a representative basket of goods and services, including food, housing, transportation, and medical care. The “All Items” index reflects overall inflation and is used to adjust nominal (non-inflation-adjusted) economic data for changes in purchasing power.
Bloomberg U.S. Long Treasury Index is a market value-weighted index of investment-grade, fixed-rate, public obligations of the U.S. Treasury with maturities of 10 years or more.
The MOVE Index (Merrill Lynch Option Volatility Estimate) is a measure of interest rate volatility in the U.S. Treasury market.
S&P 500 index is a market capitalization-weighted index of 500 common stocks chosen for market size, liquidity, and industry group representation to represent U.S. equity performance.
DISCLOSURES
Views expressed are as of the date indicated, based on the information available at that time, and may change based on market and other conditions. Unless otherwise noted, the opinions provided are those of the authors and not necessarily those of Fidelity Investments or its affiliates. Fidelity does not assume any duty to update any of the information.
Investment decisions should be based on an individual’s own goals, time horizon, and tolerance for risk.
These materials are provided for informational purposes only and should not be used or construed as a recommendation of any security, sector, or investment strategy.
Stock markets, especially foreign markets, are volatile and can decline significantly in response to adverse issuer, political, regulatory, market, or economic developments.
Foreign securities are subject to interest rate, currency exchange rate, economic, and political risks, all of which are magnified in emerging markets.


