


Blockbuster 2025 ETF flows
ETFs took in a record $1.5 trillion in inflows.
- Exchange-traded fund (ETF) flows surpassed $1 trillion annually for the second consecutive year.
- Fixed income ETF flows surged in 2025 with $426 billion of inflows.
- December set the monthly record with $256 billion in total inflows.
Here were the biggest trends within ETFs last year that can help investors find where the momentum may be to start this year.
ETF flows smash records
A record 1,097 ETFs were launched in 2025, of which 912 were actively managed.1 At the current pace, the number of ETFs is projected to exceed mutual funds by early 2027. ETFs now represent 37% of combined ETF and mutual fund assets, continuing a steady multi-year increase.
Gluttonous demand in December helped ETF flows blow past the prior year. ETFs hauled in a massive $1.5 trillion in inflows in 2025, ending the year with $13.4 trillion in assets under management across more than 4,800 ETFs. December's record-breaking single month ETF inflows of $256 billion occurred despite a shakeout of some speculative parts of the market toward the end of last year.
Equity (e.g., stock) ETF flows once again outpaced fixed income (e.g., bond) flows, and growth strategy inflows ($141 billion) topped value strategy inflows ($93 billion).
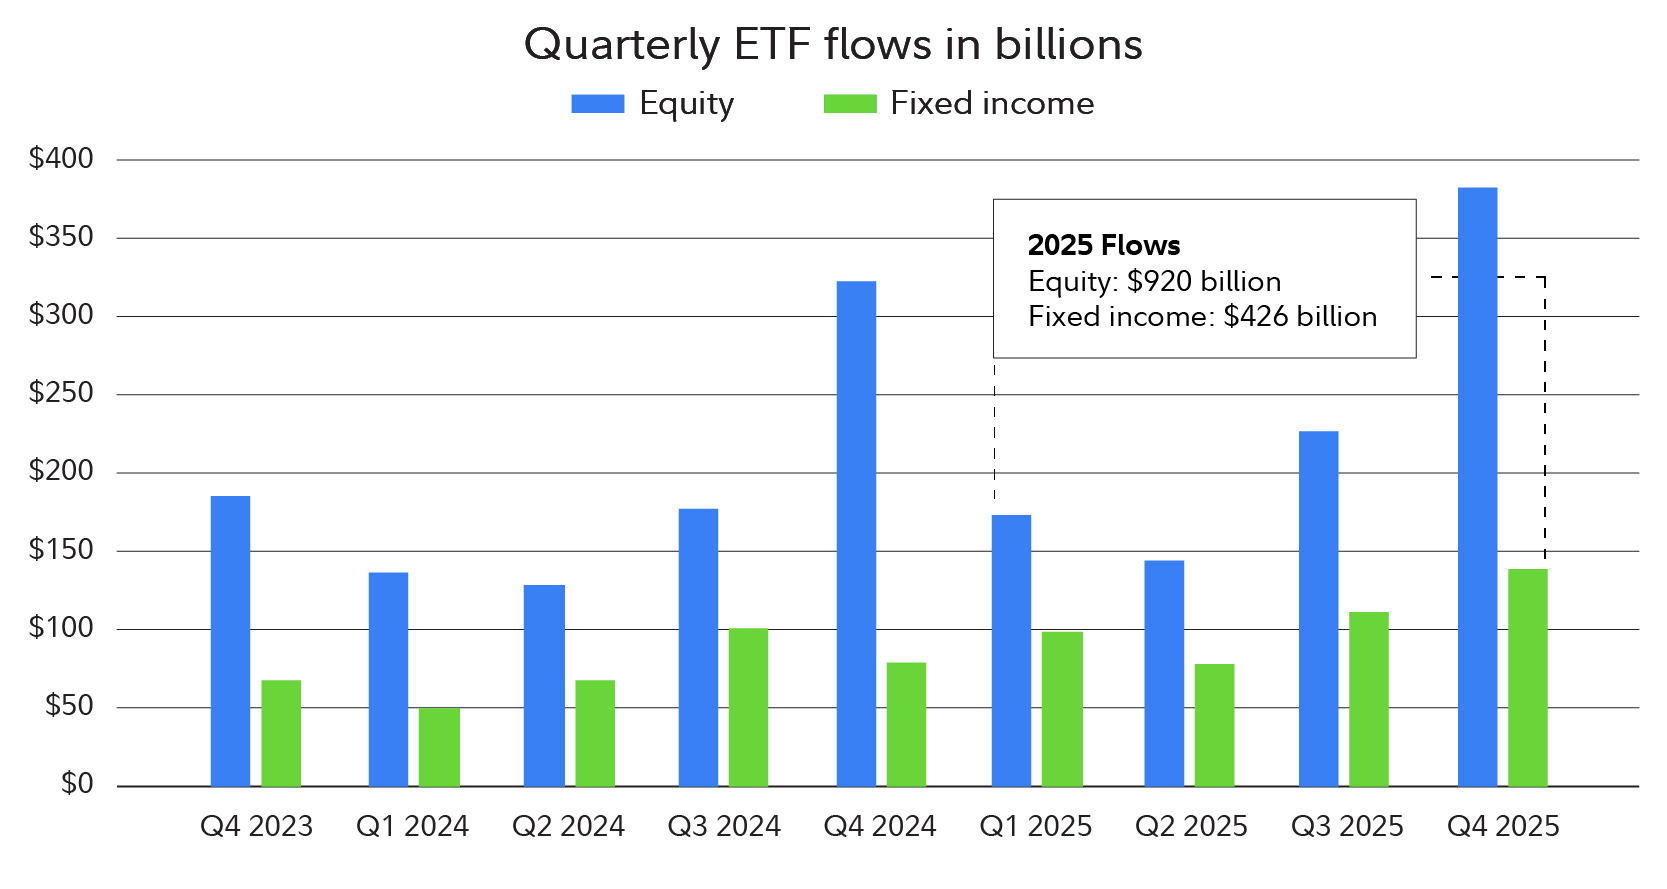
Source: Fidelity Investments, as of January 15, 2026.
Despite falling short of equity ETF flows, fixed income ETF flows had a banner year with $426 billion of inflows. Those were led by aggregate ($171 billion) and government ($110 billion) fixed income ETFs. The only fixed income category with net outflows for the year was bank loans.
Tech takes top sector billing again
Even though tech stocks came under some pressure near year-end, this sector was the runaway leader among sector-themed ETFs. Tech sector ETFs accrued $38 billion in inflows, far ahead of second place in this category, which was industrials. All but 3 of the 11 sectors saw their sector-themed ETFs experience inflows (energy, health care, and consumer staples saw outflows of $4 billion, $2 billion, and $1 billion respectively).
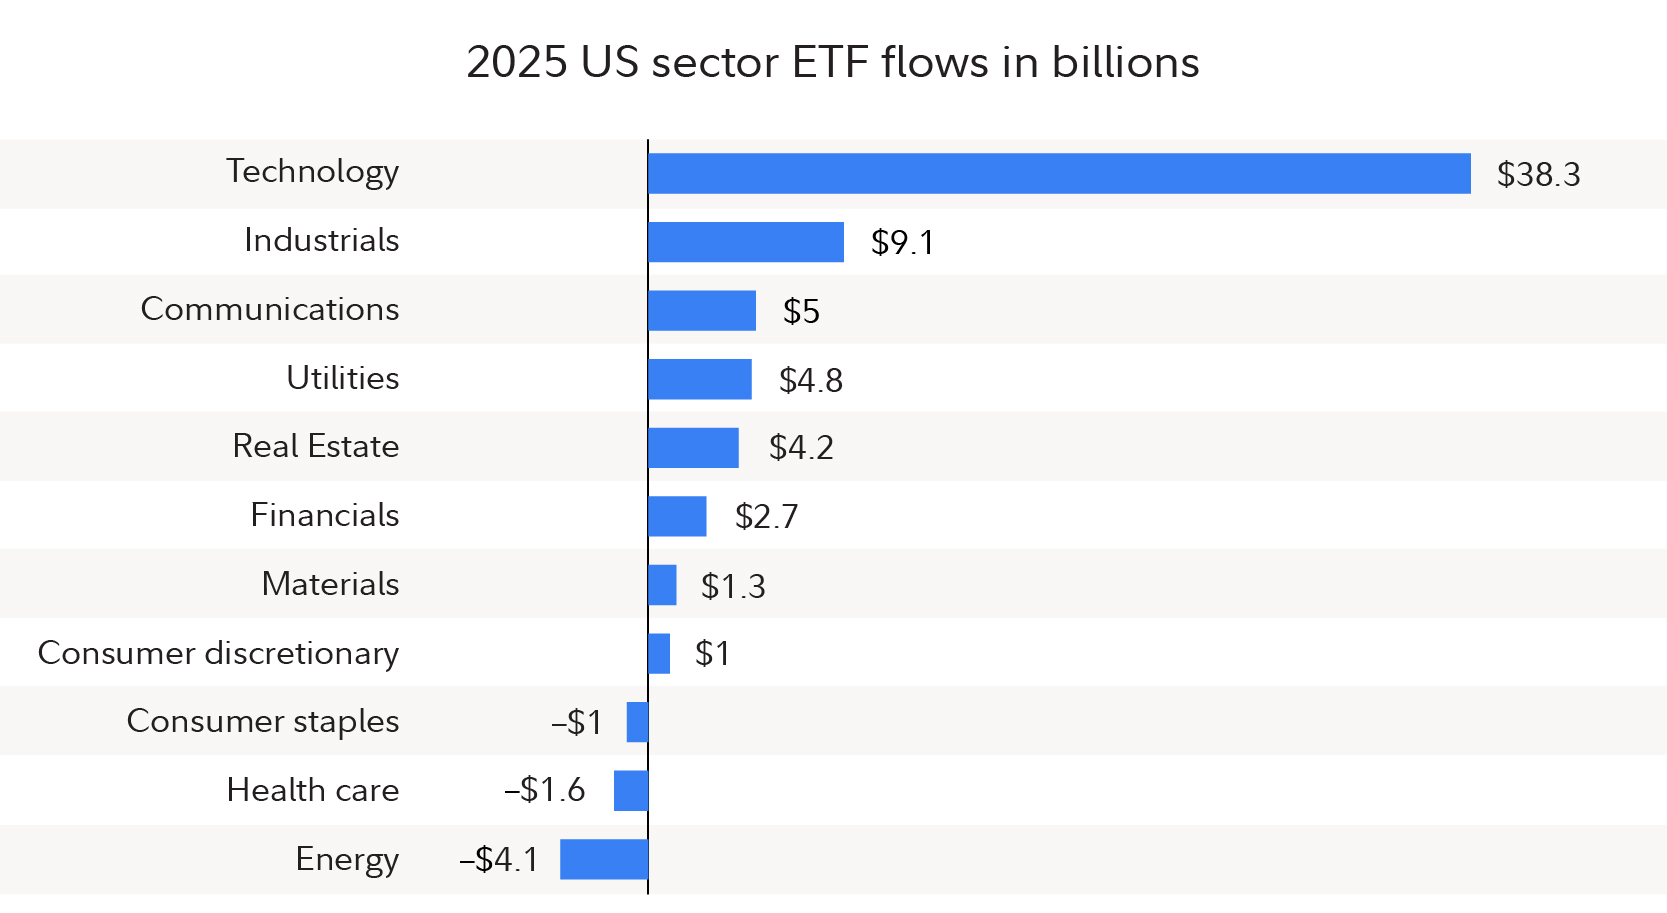
Source: Fidelity Investments, as of January 15, 2026.
It will be interesting to see if some of these sector trends reverse at the outset of the year, given the relative underperformance of tech stocks as well as the outperformance of energy and consumer staples stocks in the early weeks of 2026.
A trend that has shown no signs of changing is the rapid growth of actively managed ETF offerings. Active equity ETFs which, in contrast to passively managed ETFs are not designed to track a benchmark, brought in $280 billion, up materially from $174 billion in 2024. With that said, passively managed ETFs still dominate flows between these 2 categories.
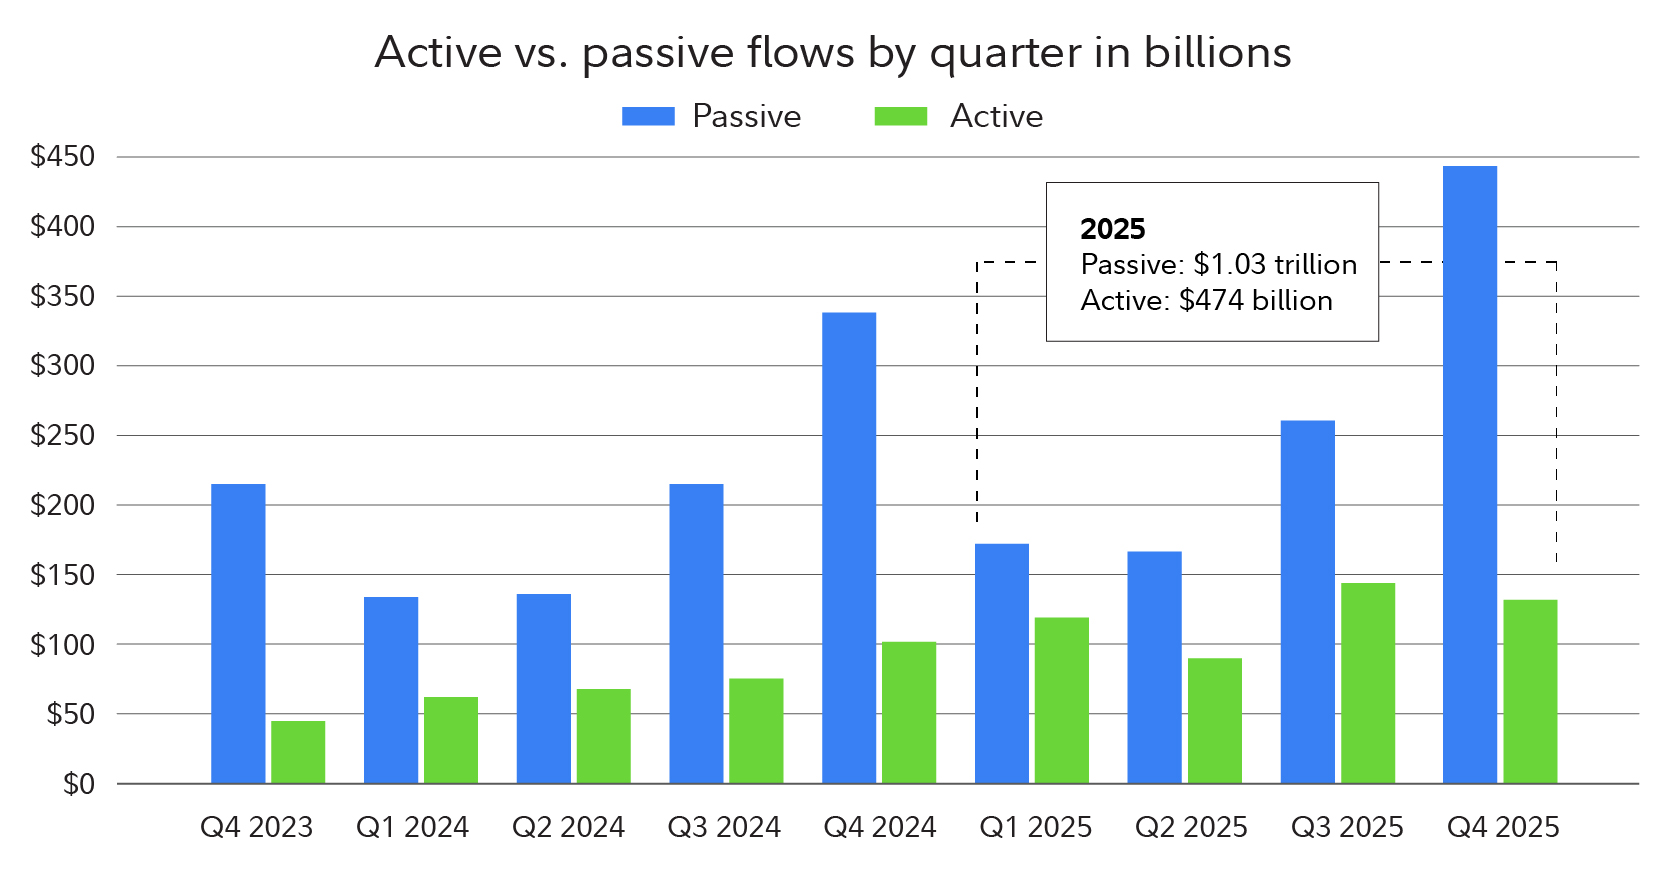
Source: Fidelity Investments, as of January 15, 2026.
Active equity ETFs
Unlock unique investment opportunities and construct a stronger core with our industry-leading approach to active ETFs.
Learn more
Quantitative Investing
Find out how a blend of human insight, data, and technology can help uncover opportunity for your clients.
Learn more
Sector/Industry
Target specific segments of the economy with our full spectrum of sector funds, ETFs, and other solutions.
Learn more
Related insights
View all


ETFs are subject to market fluctuation and the risks of their underlying investments. ETFs are subject to management fees and other expenses.
1. All the data presented within are from Fidelity Investments and Bloomberg, as of January 15, 2026. These data do not reflect mutual fund data, and investors who would like to monitor the entire fund flow universe may want to consider flows going into or out of mutual funds.
Fidelity Investments® provides investment products through Fidelity Distributors Company LLC; clearing, custody, or other brokerage services through National Financial Services LLC or Fidelity Brokerage Services LLC; and institutional advisory services through Fidelity Institutional Wealth Adviser LLC.